AirBnB-dataAnalysis
AirBnB dataset
Course: MGOC15 - Introductory Business Data Analytics
Topics Tested: Modifying Dataframes, Categorical Imputation, Outliers
Florence AirBnB Bookings
We have a dataset called “AirBnB.csv”. Some important columns:
BookingsPerMonth - denotes the average number of bookings a property has received in a given month (Since this denotes the total number of bookings divided by the time period, it is likely to be a fraction).
CommissionsPerMonth - how much airbnb collects in commissions from a given property.
Loading Python modules
We start by first importing packages and modules needed for our analysis
import pandas as pd               # for data manipulation
import numpy as np                # for stats and numerical analysis
import matplotlib.pyplot as plt   # for plotting and data visualization

# Disable SetttingwithCopyWarning
# Don't worry about why this line is included
pd.set_option('mode.chained_assignment', None)
Read the file before proceeding
df_airbnb = pd.read_csv('AirBnB.csv')
df_airbnb
| HostResponseTime | HostResponseRate | HostAcceptRate | Superhost | HostListings | Neighborhood | Latitude | Longitude | RoomType | Accomodates | ... | AvgRating | RatingAccuracy | RatingClean | RatingCheckIn | RatingCommunication | RatingLocation | RatingValue | Instant Booking | BookingsPerMonth | CommissionsPerMonth | |
|---|---|---|---|---|---|---|---|---|---|---|---|---|---|---|---|---|---|---|---|---|---|
| 0 | within an hour | 1.00 | 1.00 | f | 32 | Centro Storico | 43.777090 | 11.252160 | Private room | 2 | ... | 4.65 | 4.73 | 4.87 | 4.85 | 4.91 | 4.90 | 4.71 | t | 1.19 | 34.8075 |
| 1 | within an hour | 1.00 | 1.00 | f | 5 | Centro Storico | 43.762680 | 11.241490 | Hotel room | 2 | ... | 4.84 | 4.82 | 4.87 | 4.88 | 4.92 | 4.71 | 4.82 | t | 4.58 | 144.2700 |
| 2 | within an hour | 1.00 | 0.83 | f | 10 | Centro Storico | 43.775250 | 11.252580 | Private room | 2 | ... | 4.47 | 4.60 | 4.65 | 4.79 | 4.72 | 4.88 | 4.49 | f | 0.65 | 14.6250 |
| 3 | within an hour | 1.00 | 0.83 | f | 10 | Centro Storico | 43.775250 | 11.252580 | Private room | 2 | ... | 4.08 | 3.83 | 4.33 | 4.58 | 4.42 | 5.00 | 4.17 | f | 0.56 | 15.1200 |
| 4 | within an hour | 1.00 | 1.00 | f | 189 | Centro Storico | 43.769440 | 11.263310 | Entire home/apt | 2 | ... | 3.00 | 4.00 | 4.00 | 4.50 | 3.50 | 4.50 | 4.00 | t | 0.03 | 1.4445 |
| ... | ... | ... | ... | ... | ... | ... | ... | ... | ... | ... | ... | ... | ... | ... | ... | ... | ... | ... | ... | ... | ... |
| 5669 | within an hour | 1.00 | 1.00 | f | 14 | Rifredi | 43.794050 | 11.240850 | Entire home/apt | 2 | ... | 4.00 | 4.00 | 5.00 | 5.00 | 5.00 | 3.00 | 4.00 | t | 1.00 | 23.8500 |
| 5670 | within an hour | 0.97 | 1.00 | t | 8 | Isolotto Legnaia | 43.766420 | 11.238470 | Private room | 2 | ... | 5.00 | 5.00 | 5.00 | 5.00 | 5.00 | 5.00 | 5.00 | t | 1.00 | 17.5500 |
| 5671 | within a day | 1.00 | 1.00 | f | 0 | Campo di Marte | 43.785920 | 11.289180 | Entire home/apt | 4 | ... | 5.00 | 5.00 | 5.00 | 5.00 | 5.00 | 4.67 | 4.67 | t | 3.00 | 135.0000 |
| 5672 | within a few hours | 1.00 | 1.00 | f | 0 | Campo di Marte | 43.787490 | 11.264180 | Entire home/apt | 2 | ... | 5.00 | 5.00 | 5.00 | 5.00 | 5.00 | 5.00 | 5.00 | t | 1.00 | 14.4000 |
| 5673 | within an hour | 1.00 | 0.77 | f | 0 | Rifredi | 43.790207 | 11.251734 | Private room | 2 | ... | 5.00 | 5.00 | 5.00 | 5.00 | 5.00 | 5.00 | 5.00 | f | 1.00 | 12.1500 |
5674 rows × 31 columns
Modifying data
a) The residents in the historic Centro Storico neighbourhood are complaining that AirBnB is extracting too much of their revenue as commission. In response, AirBnB has instituted a new rule where they will no longer collect more than $1000 a month from any property in the Centro Storico neighborhood., i.e., all commissions are capped at \$1000 for this neighbourhood alone. The excess money has been refunded to all hosts. Please make the changes in the CommissionsPerMonth column to reflect this.
b) some houses have listed the number of bathrooms as 1.5 and these need to be rounded up to 2. Use df.loc to solve this problem.
#Solution for Part a
df_airbnb.loc[(df_airbnb['CommissionsPerMonth']>1000), 'CommissionsPerMonth']=1000
#Solution for Part b
df_airbnb.loc[(df_airbnb['Bathrooms'] == 1.5), 'Bathrooms']=2
Outliers
One of our future goals is to understand how the booking rate depends on features such as Average Rating (AvgRating). Before we start studying correlations, however, we need to check whether these two fields (BookingsPerMonth/AvgRating) have any outliers. If so, deal with them before proceeding.
Use both visualizations and statistics to answer the question. This question only requires you to remove the corresponding outliers.
Follow-up Question: Can categorical columns have outliers? Explain why/why not.
#Answer 2a
# First, let's visualize the 'AvgRating' column
plt.figure(figsize=(14, 5))
plt.subplot(1, 2, 1)
df_airbnb['AvgRating'].plot.box()
plt.subplot(1, 2, 2)
df_airbnb['AvgRating'].plot.hist()
<AxesSubplot: ylabel='Frequency'>
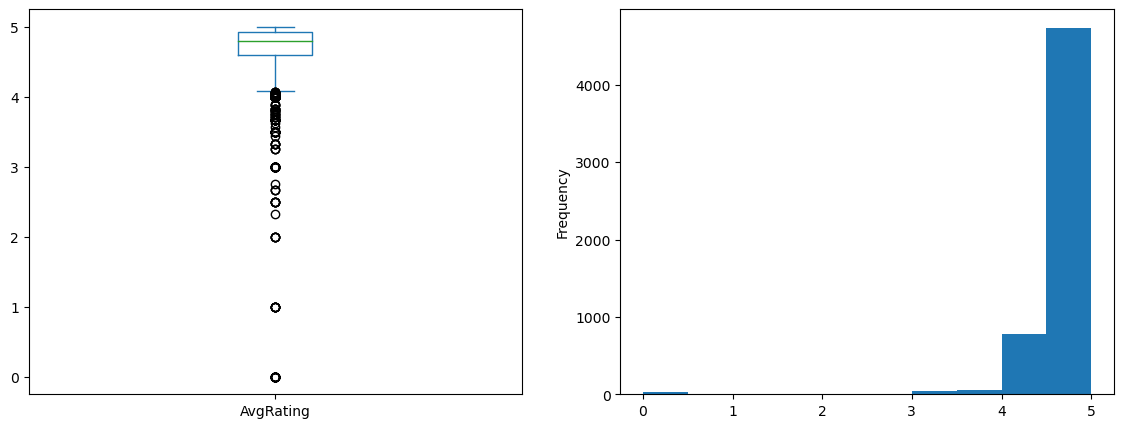
#The 'AvgRating' graphs show that AvgRating is left-skewed. Let's use statistics to identify outliers.
ratingThr = df_airbnb['AvgRating'].mean() - 5*df_airbnb['AvgRating'].std()
# let's visualize the 'BookingsPerMonth' column
plt.figure(figsize=(14, 5))
plt.subplot(1, 2, 1)
df_airbnb['BookingsPerMonth'].plot.box()
plt.subplot(1, 2, 2)
df_airbnb['BookingsPerMonth'].plot.hist()
<AxesSubplot: ylabel='Frequency'>

#The 'BookingsPerMonth' graphs show that BookingsPerMonth is right-skewed. Let's use statistics to identify outliers.
bookingThr = df_airbnb['BookingsPerMonth'].mean() + 5*df_airbnb['BookingsPerMonth'].std()
df_noRat = df_airbnb[ df_airbnb['AvgRating'] > ratingThr]
df_noOut = df_noRat[df_noRat['BookingsPerMonth'] < bookingThr]
#Answer 2b (Follow-up Question) The question of whether a categorical data contains an outlier depends on how you approach it and what you want to do with the data. It can be said that, for a column to have an outlier, there should be a quantitative measure that can be used to compare/contrast. Since categorical columns do not contain quantitative data, they cannot have outliers. However, if a category was miscategorized (e.g., a color that doesn’t exist) and, therefore, have no or very few values in the data, then it could be taken as an outlier.
Categorical Imputation
Unfortunately, the dataset is missing several entries for its Price column (we do not wish to delete them due to potential bias). Instead of simply replacing everything with the average price, you proposed a more nuanced approach where you would use the number of Bedrooms in the listing to determine its price — after all, won’t most 2 bedroom houses be priced similarly?
Your co-worker on the other hand is skeptical of this approach because houses with the same number of bedrooms can be priced very differently based on other features.
a) First, convince your co-worker that houses with more bedrooms have a higher average price, i.e., increasing the number of bedrooms leads to a higher average price.
b) Assuming that you were successful in convincing her, use categorical imputation based on the number of bedrooms to fill in the missing price entries.
(There is no need to remove any additional outliers for this question)
Hint: If you are lazy, you can try a for loop.
#Answer for Part a
#We will divide the data into two categories: houses with more bedrooms vs. houses with fewer bedrooms.
#but for doing do, we need to identify a split we can use for dividing it into the two categories
#let's first get generic information using the function 'describe'
df_noOut['Bedrooms'].describe()
count    5399.000000
mean        1.566401
std         0.865110
min         1.000000
25%         1.000000
50%         1.000000
75%         2.000000
max         9.000000
Name: Bedrooms, dtype: float64
# 2 should be a good number for the split
split = 2
dfMore = df_noOut[ df_noOut['Bedrooms'] > split ]
dfFew = df_noOut[df_noOut['Bedrooms'] <= split]

MorePrice = dfMore['Price'].mean()
FewPrice = dfFew['Price'].mean()

print('Average price of houses with more than 2 bedrooms is ', MorePrice)
print('Average price of houses with 2 or fewer bedrooms is ', FewPrice)
print('The statement is indeed true, i.e., the average price of houses with more bedrooms is indeed higher than those with fewer bedrooms')
Average price of houses with more than 2 bedrooms is  197.79443585780527
Average price of houses with 2 or fewer bedrooms is  85.99259415996615
The statement is indeed true, i.e., the average price of houses with more bedrooms is indeed higher than those with fewer bedrooms
#Answer for Part b
df_noOut.loc[(df_noOut['Price'].isnull()) & (df_noOut['Bedrooms'] > split), 'Price'] = MorePrice
df_noOut.loc[(df_noOut['Price'].isnull()) & (df_noOut['Bedrooms'] <= split), 'Price'] = FewPrice
Numeric to Categorical Columns
The city wants to divide the AirBnBs into high-volume homes (lots of bookings) and low-volume homes (fewer bookings). Categorical columns are typically much easier to deal with than numeric columns. With this in mind, create a new column called cat_booking - the column must equal one (or True) if the property is a high-volume property and equal 0 (or False) if it is a low-volume property.
Use any suitable threshold for the BookingsPerMonth column as discussed in class.
#Answer for Q4
df_noOut['BookingsPerMonth'].describe()
count    5628.000000
mean        1.449733
std         1.435517
min         0.010000
25%         0.300000
50%         1.000000
75%         2.160000
max         8.750000
Name: BookingsPerMonth, dtype: float64
BookingSplit = 2
df_noOut['cat_booking'] = df_noOut['BookingsPerMonth'] > BookingSplit